

Where the test panel lives
Click any Type in the project sidebar (an entry under UI Tools or Data Tools). The center pane shows the Type’s detail; the right pane is the test panel.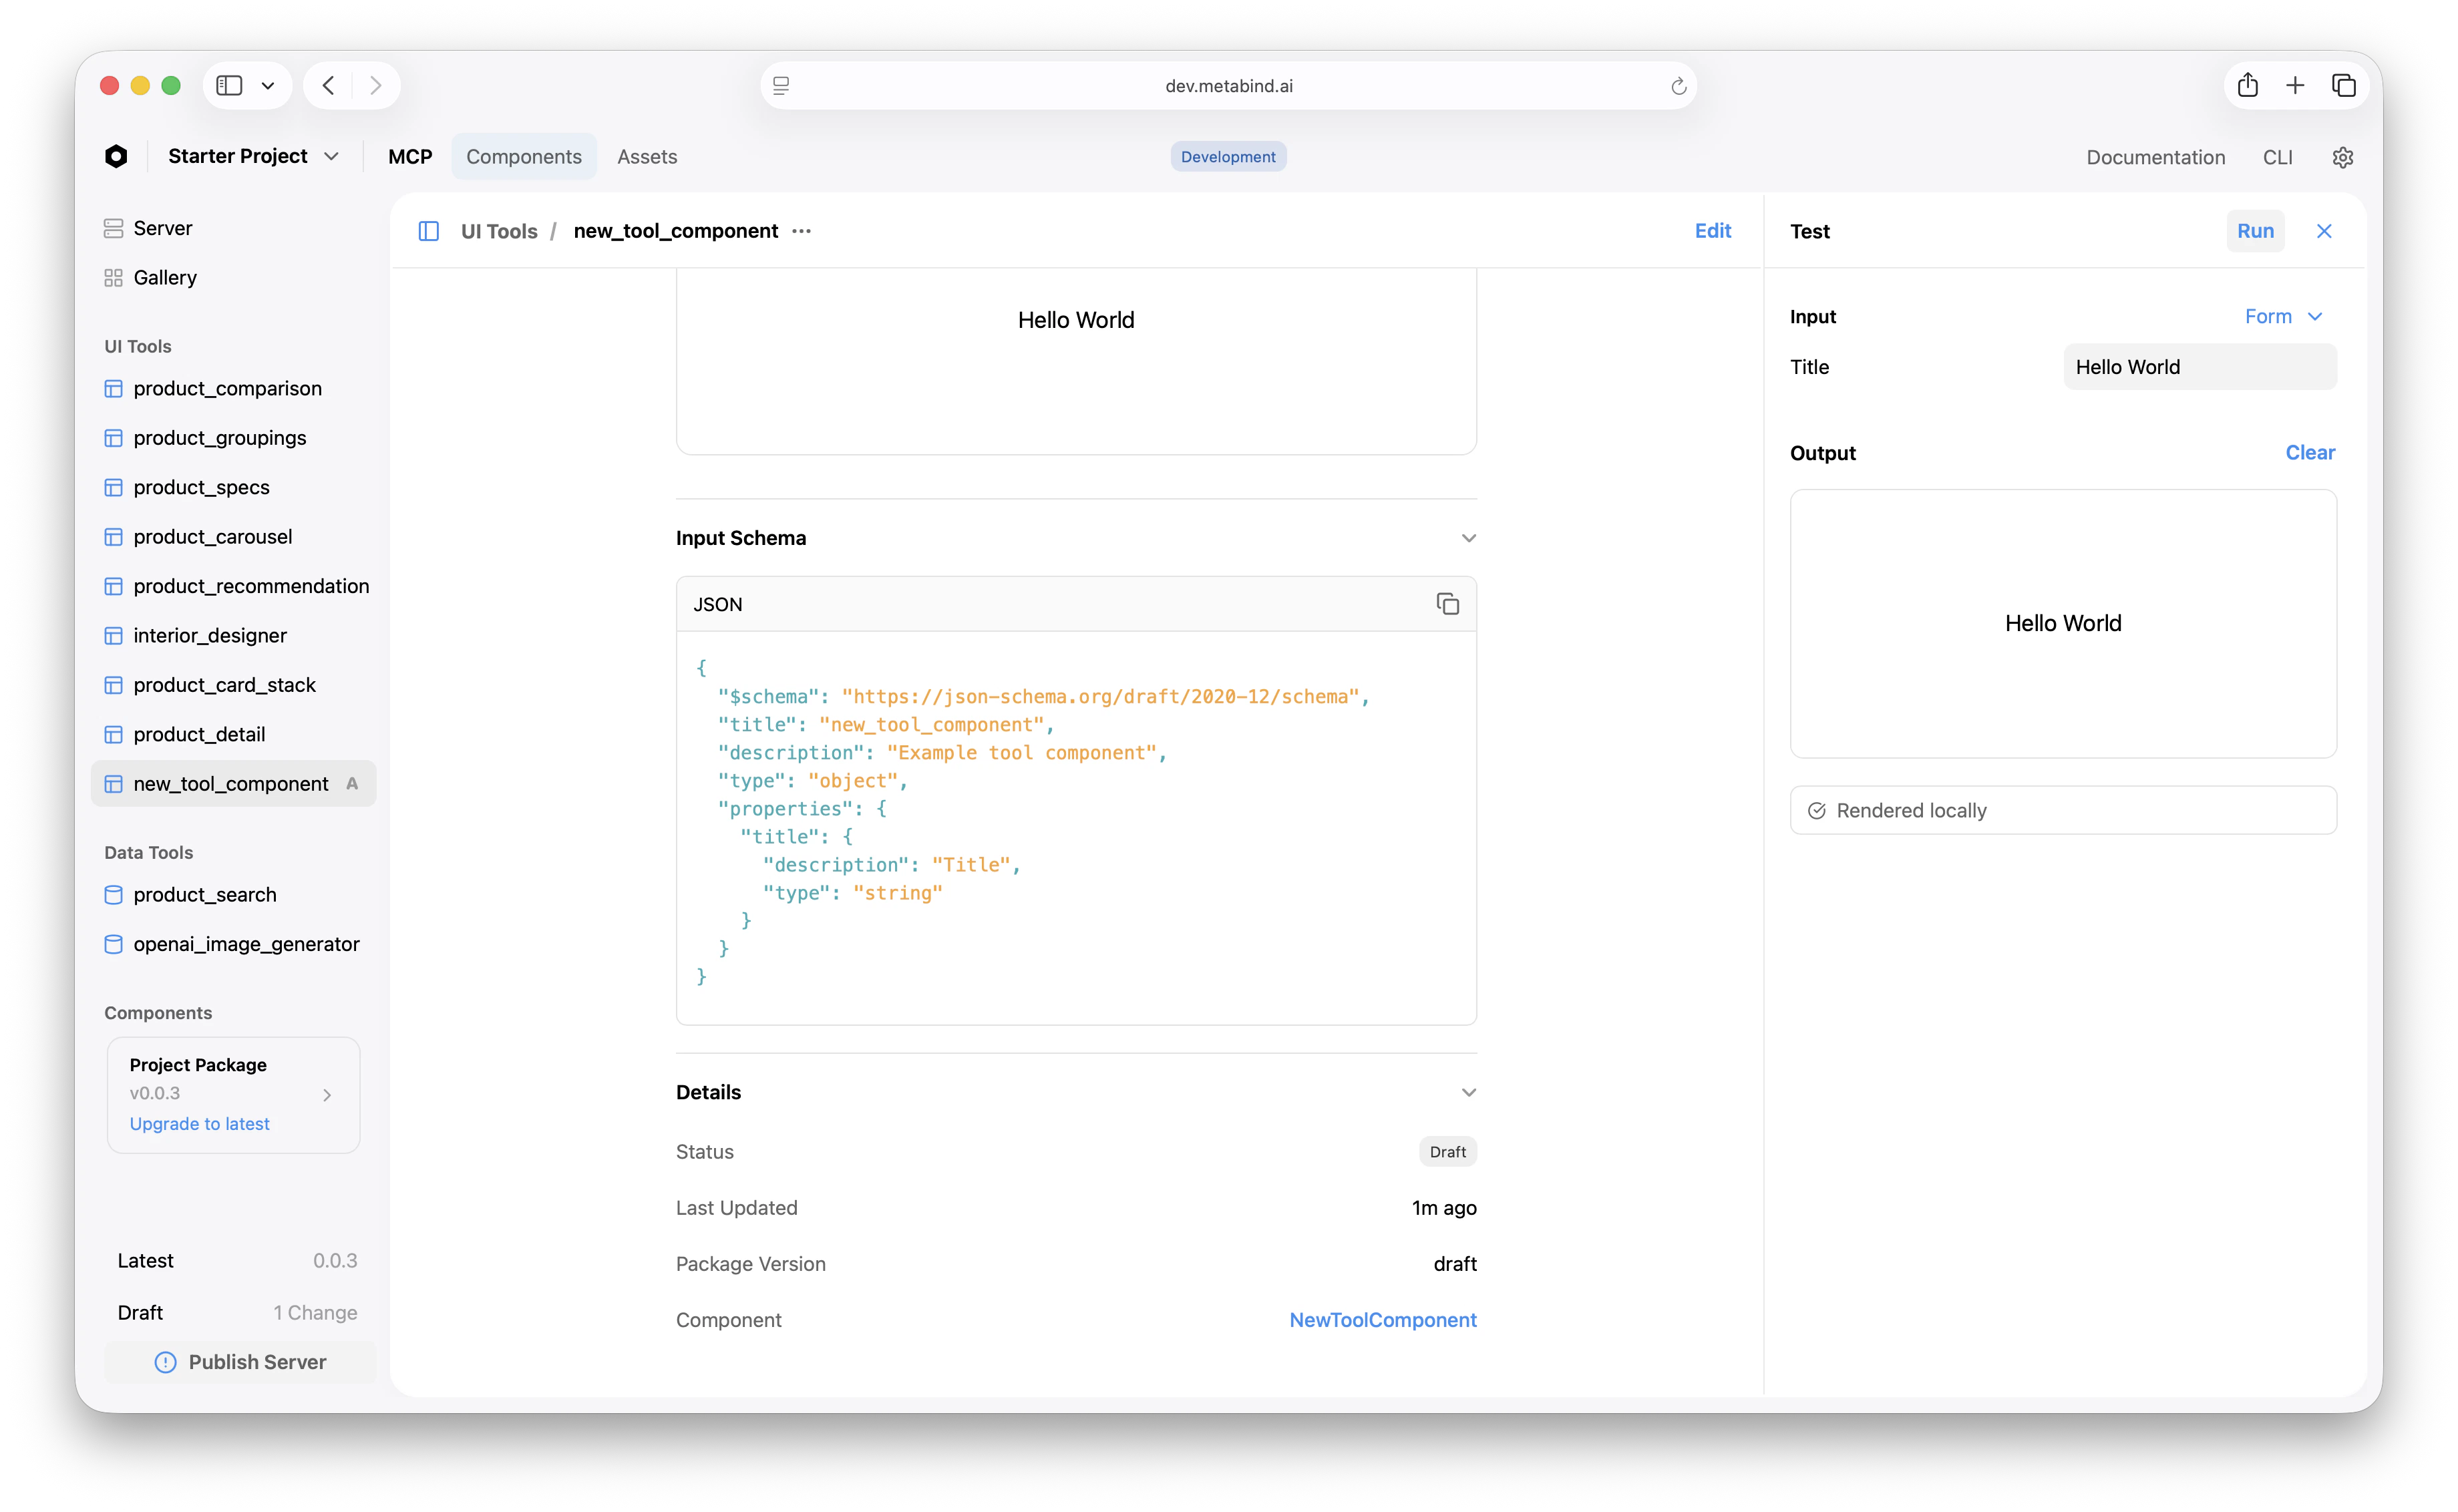
What “Run” does
Clicking Run runs the full live path:- The form input is converted to a structured tool call.
- The platform validates the input against the Type’s schema.
- For Interactive Tools: BindJS is compiled, the package is resolved, and the result renders in the output area.
- For Data Tools: the handler runs in a V8 sandbox, secrets are injected, the API call (if any) goes out, and the structured response renders as JSON.
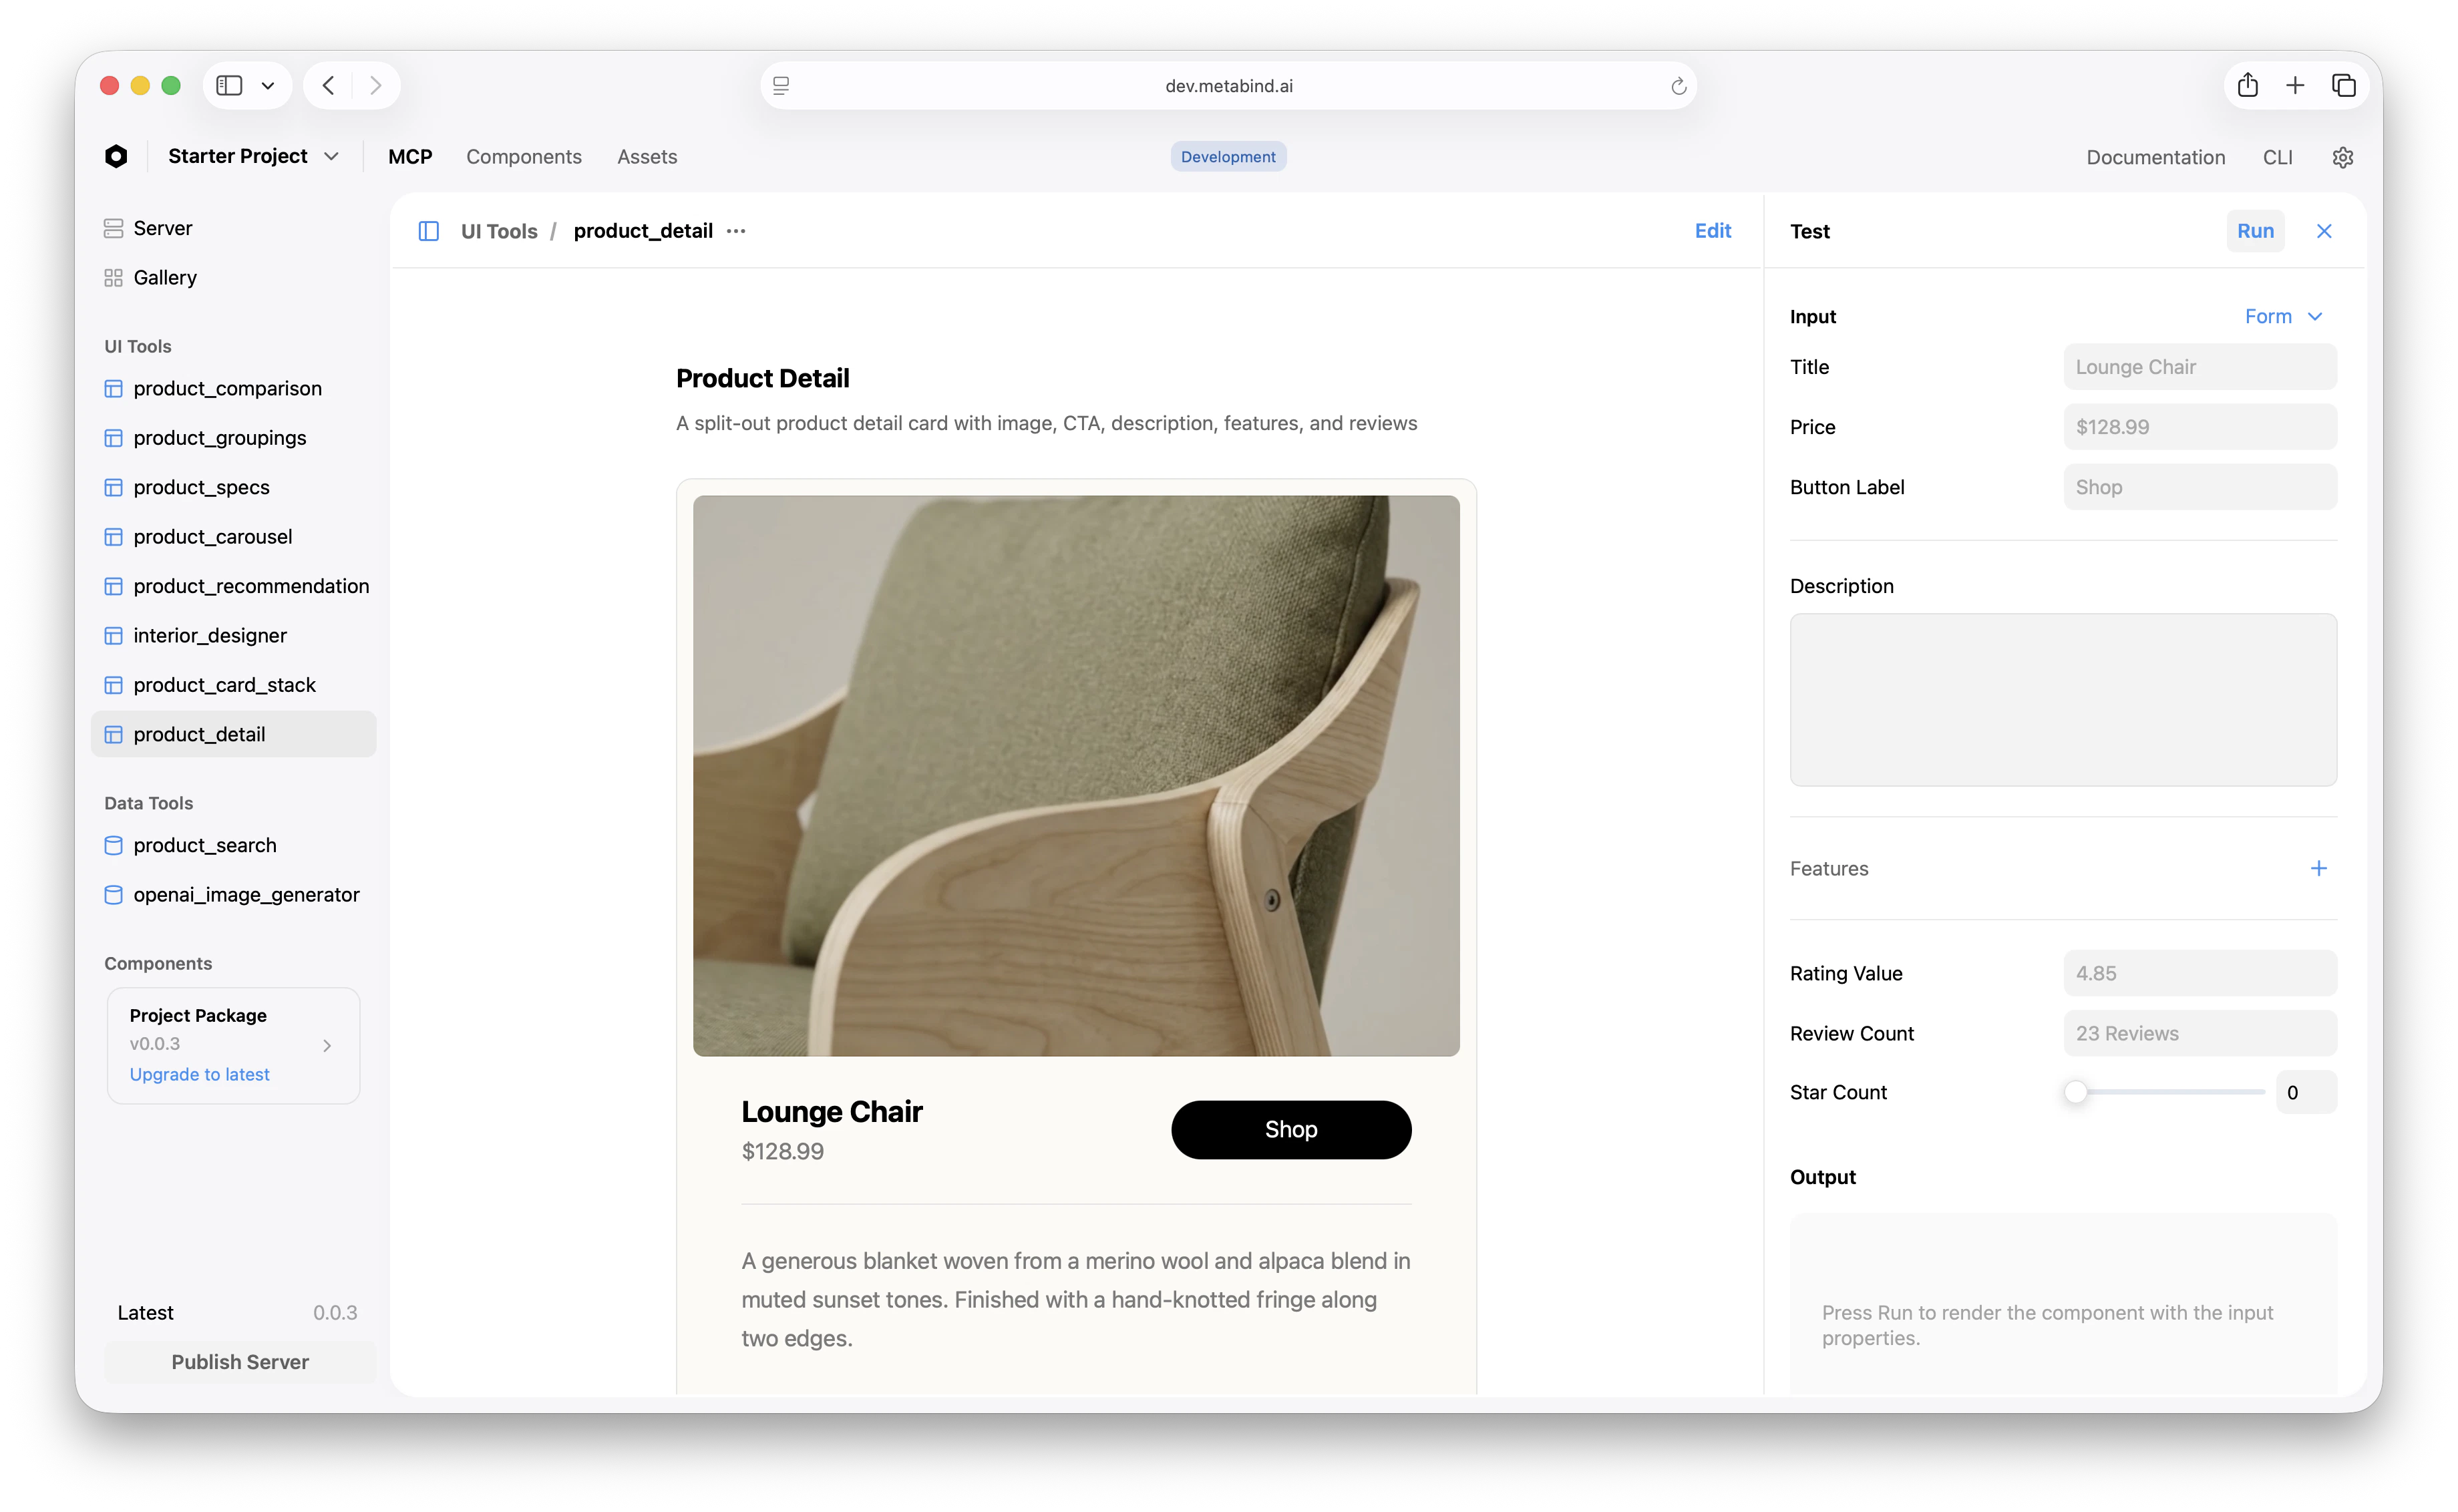
Testing Interactive Tools
The test panel for an Interactive Tool shows the rendered output. A few patterns:- Use the component’s
previewsarray as starting points. MCP App Studio surfaces those as preset inputs you can pick from a dropdown. - Test edge cases by hand. Empty arrays, very long strings, missing optional fields — the tests you’d write in code, written here as inputs.
- Test schema rejection. Provide deliberately bad input (wrong type, out-of-range number) and confirm the platform rejects it cleanly with a useful error.
- Test allowlist enforcement. If your tool has component allowlists, try sending a disallowed component name in the JSON. The platform should reject it before rendering.
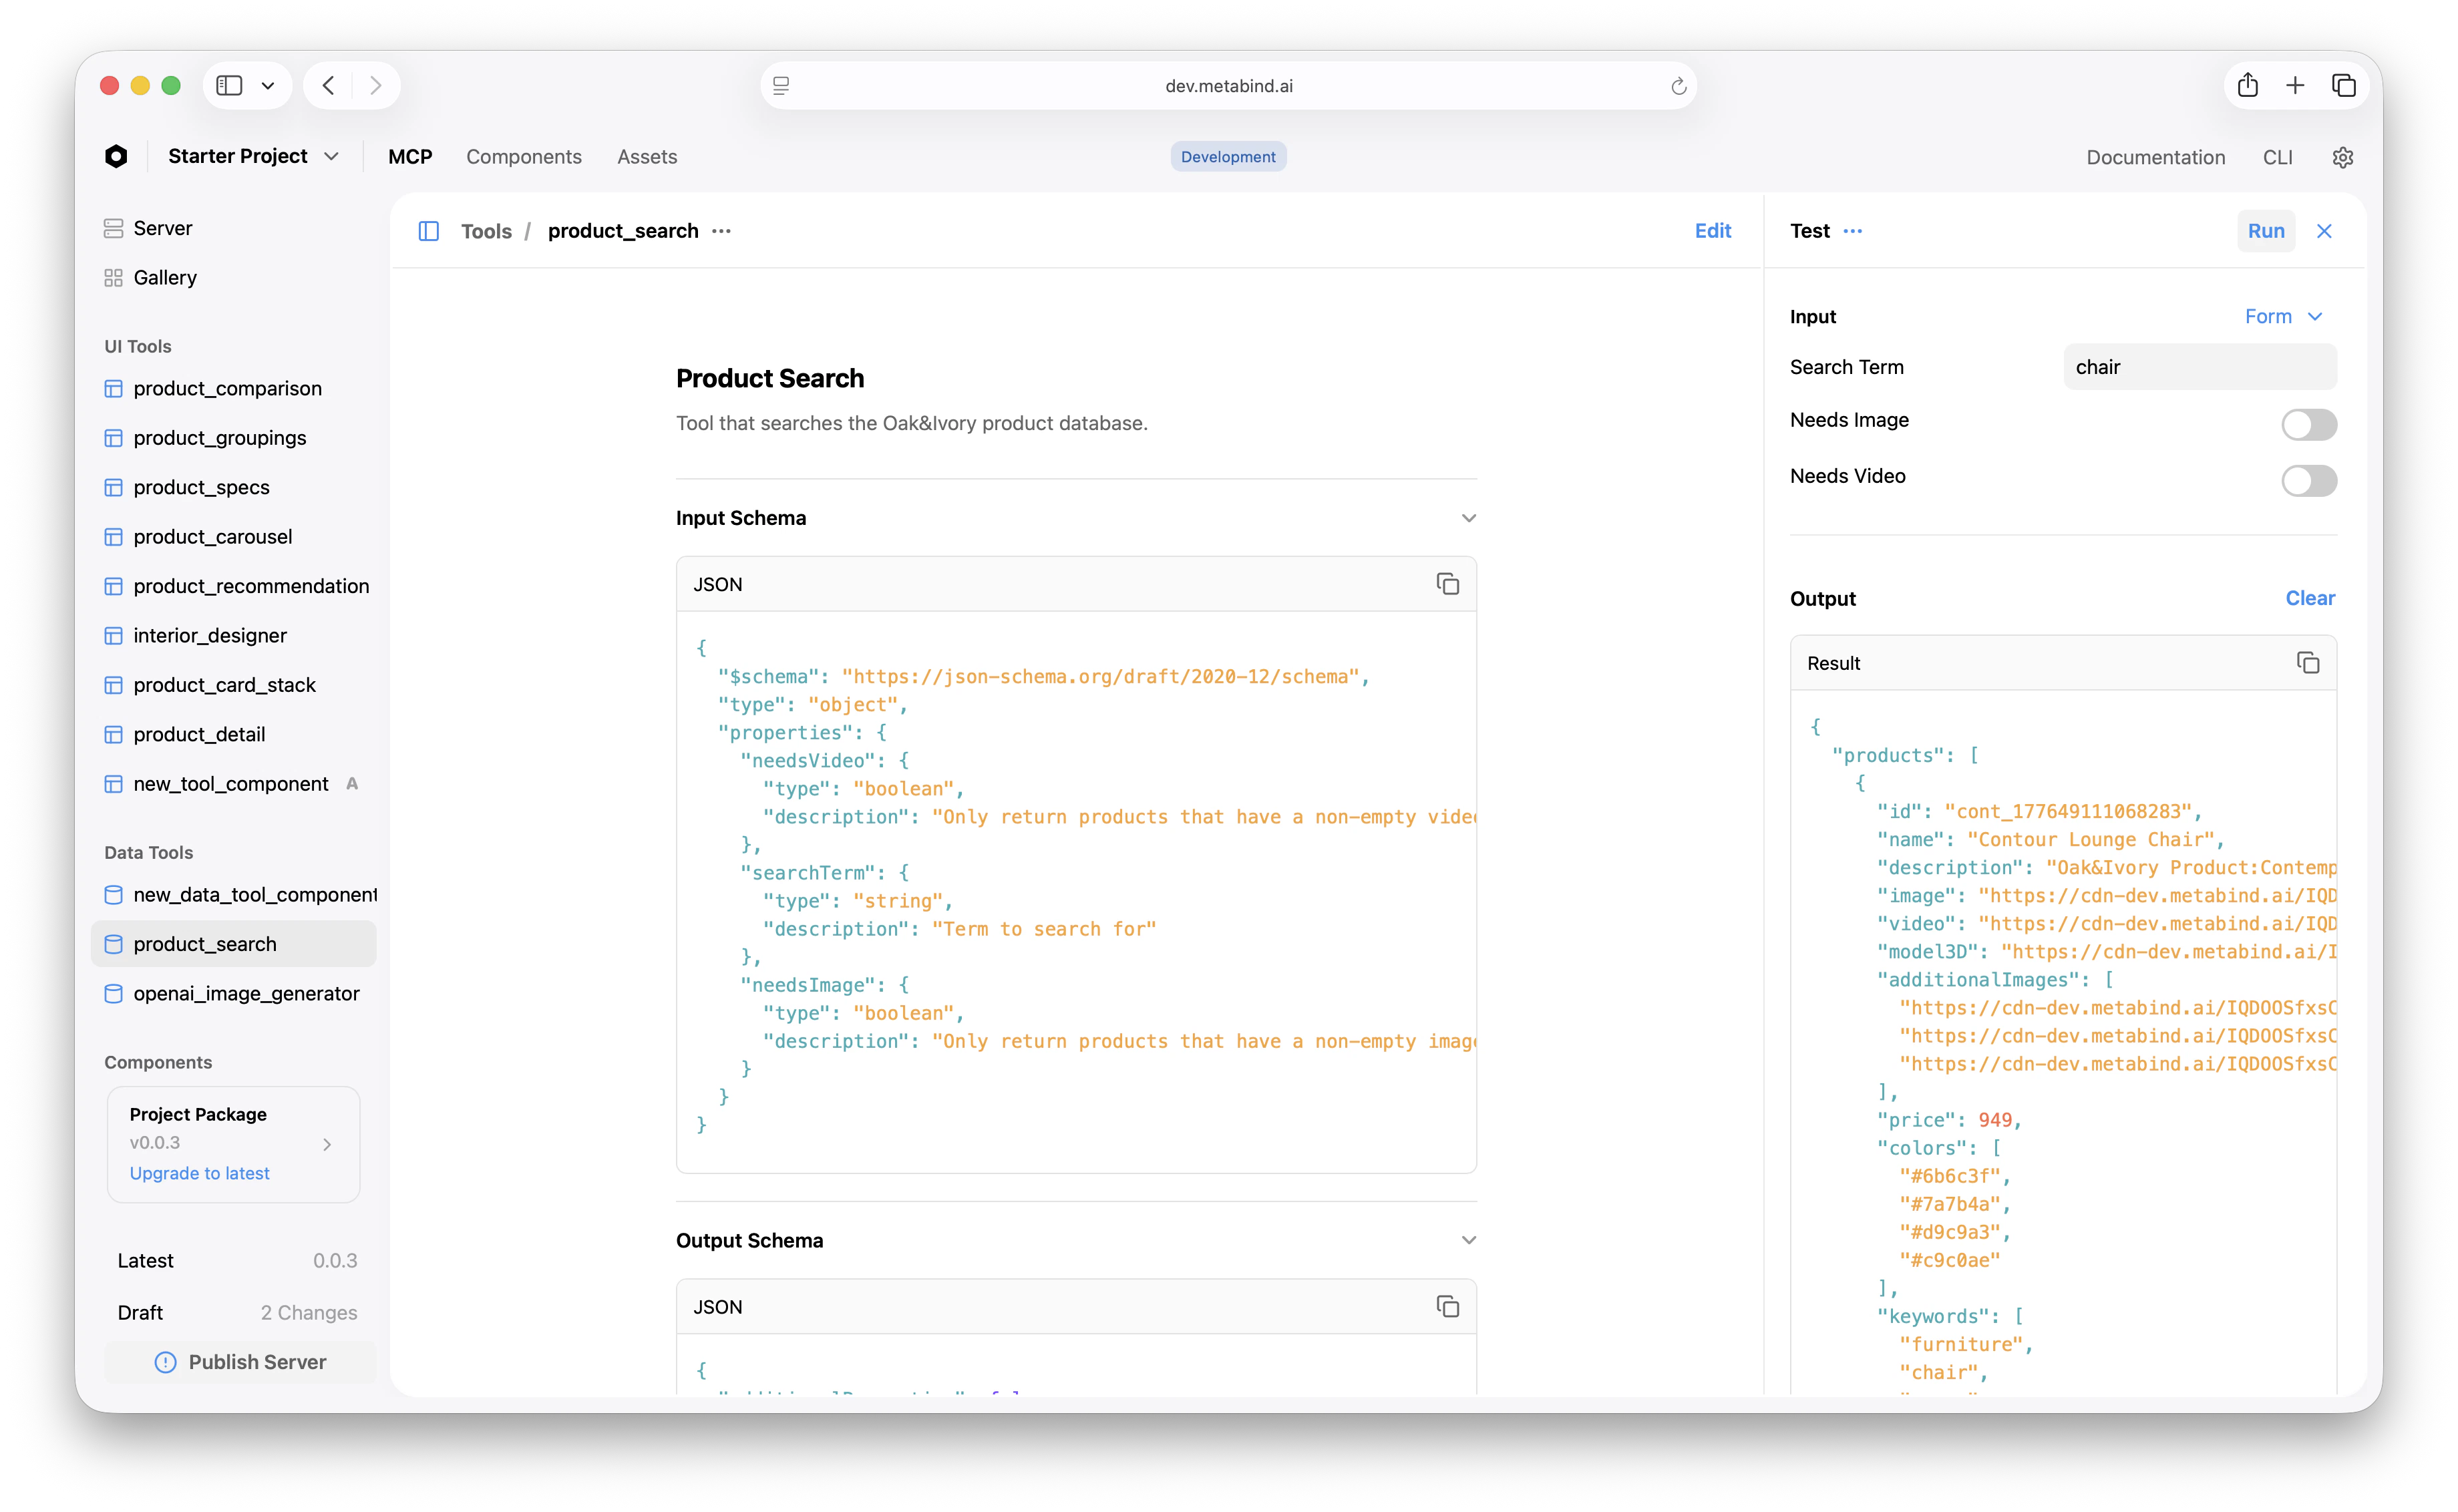
Testing Data Tools
The test panel for a Data Tool shows the structured JSON response. A few patterns:- Test against real data first. A Data Tool that searches a product catalog should return real products from your catalog. Don’t mock — the integration is what you’re testing.
- Test failure modes. What does the tool return when the API is down? When the API key is missing? When the input matches no results? The handler should fail cleanly.
- Watch the audit log. Every test panel run is logged with timestamp, input, and output. Use the log to debug intermittent issues.
- Watch console output.
console.logcalls inside the handler appear in the audit log, not the test panel — but they’re captured.
Authorization for Data Tools
Data Tools that access external services need authorization. The first time you test a Data Tool, MCP App Studio prompts you to Authorize — this generates a session token scoped to your project’s draft endpoint. After authorizing once, subsequent tests run without re-authorization for the rest of the session.Testing the whole tool chain
For a flow that chains a Data Tool and an Interactive Tool — for example,product_search → product_detail — test each tool independently first, then test the chain end-to-end using a connected MCP host with the draft URL.
The reason: the test panel runs one tool per click. End-to-end chain testing requires an actual model deciding which tool to call, which means running through Claude Desktop or another host pointed at the draft endpoint. See Connect to Claude Desktop for the draft connection setup.
What the test panel doesn’t cover
- Real LLM behavior. The test panel runs your tool with your inputs. It does not test how an AI will actually call the tool — that requires a connected host. Tool descriptions and project Instructions matter for AI behavior; tune them in real conversations, not the test panel.
- Cross-tool dependencies. A Data Tool whose output feeds an Interactive Tool needs end-to-end testing in a host. The test panel can verify each in isolation but not their interaction.
- Performance under load. The test panel runs single calls. Use real production traffic patterns for performance characterization.
Related
Build an Interactive Tool
The walkthrough that uses the test panel.
Build a Data Tool
Data Tool authoring and testing.
Live device previews
Test on real iOS and Android devices.
Audit logs
Test panel runs are logged for later review.